 | | | | | | Market Summary for September 2, 2013 - September 6, 2013 | | Commentary | The major U.S. indices moved lower this week, after a lackluster jobs report sent shares lower on Friday morning. According to the Bureau of Labor Statistics, the unemployment rate fell to 7.3% as the economy added 169,000 jobs, but these figures were largely due to a reduction in the size of the labor force. Many analysts were expecting better results, particularly as the U.S. Federal Reserve prepares to end its bond-buying program in the near-term.
Foreign markets performed better than domestic indices this week, with Britain's FTSE 100 rising 1.8%, Germany's DAX 30 rising 1.3%, and Japan's Nikkei 225 rising 3.5%. For international investors, the biggest story of the week was Japan's improving economic performance and the prospects of an ongoing stimulus program. The eurozone's economy has also recovered modestly, although ECB President Mario Draghi remains "very cautious" on the recovery. | | | | | | | | 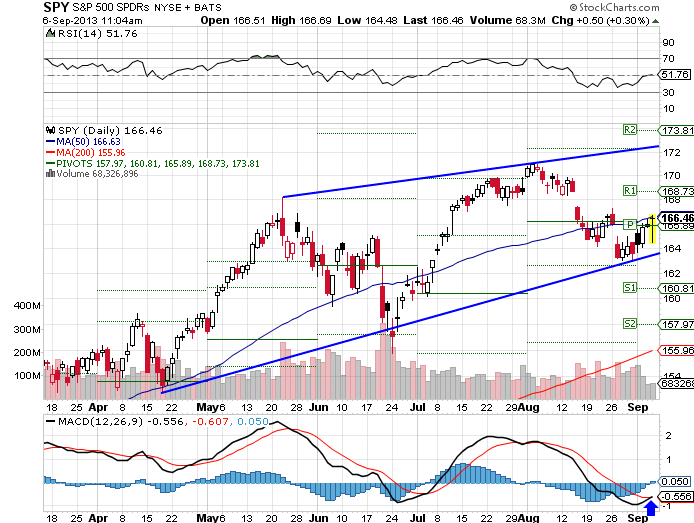 | The SPDR S&P 500 (NYSE: SPY) ETF fell 0.83% lower, as of early trading on Friday morning. After rebounding from its lower trend line, the index stands near its 165.89 pivot point and 166.63 50-day moving average. Traders should watch for a breakout from these levels to test R1 resistance at 168.73 or its upper trend line at around 172.00 or a breakdown to re-test the lower trend line or break down to S1 support at 160.81. Looking at technical indicators, the RSI appears neutral at 51.76, but the MACD could be ready for a bullish crossover. SEE: What The Unemployment Rate Doesn't Tell Us | | | PowerShares QQQ (Nasdaq: QQQ) | 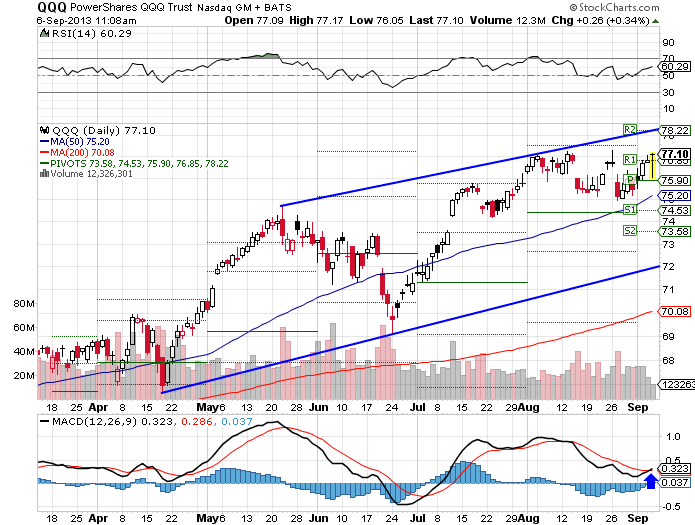 | The PowerShares QQQ (Nasdaq: QQQ) ETF fell 0.05% lower, as of early trading on Friday morning. After moving slightly lower last week, the index remains in a tight trading range within a 72.00 to 78.22 price channel, trading just above R1 resistance at 76.85. Traders should watch for a breakout to R2 resistance and the upper trend line at 78.22 or a move lower to its 50-day moving average of 75.20 or 75.90 pivot point. Looking at technical indicators, the RSI appears a bit overbought at 60.29, while the MACD could see a bullish crossover. SEE: Spotting Trend Reversals With MACD | | | Dow Jones Industrial Average ( NYSE:DIA) | 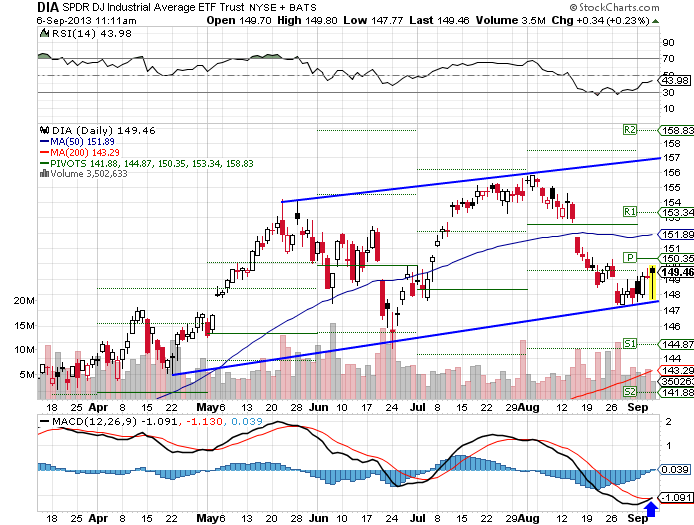 | The SPDR Dow Jones Industrial Average (NYSE: DIA) ETF fell 0.76% lower, as of early trading on Friday morning. After rebounding from its lower trend line, the index moved marginally higher near its pivot point at 150.35 and remains within a 147.50 to 157.00 price channel. Traders should watch for a continuation of the rebound to the 50-day moving average of 151.89 or a breakdown lower to S1 support at 144.87. Looking at technical indicators, the RSI remains marginally oversold at 43.98, while the MACD appears ready for a bullish crossover. | | | iShares Russell 2000 Index (NYSE: IWM) | 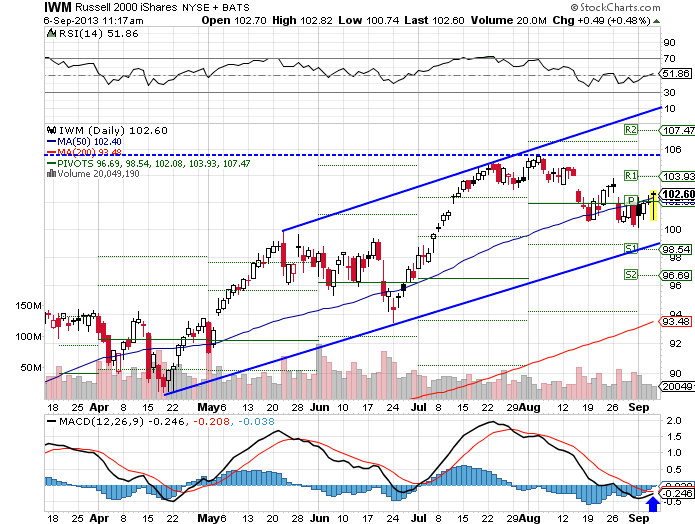 | The iShares Russell 2000 Index (NYSE: IWM) ETF fell 1.54% lower, as of early trading on Friday morning. After trading sideways around its 50-day moving average of 102.40, the index remains locked within a price channel and trading near its pivot point. Traders should watch for a breakout higher to prior highs around 105.90 or a move lower to test S1 support and lower trend line levels at around 98.50. Looking at technical indicators, the RSI appears neutral with a 51.86 reading, while the MACD appears ready for a bullish crossover. SEE: Candle Sheds More Light Than The MACD | | | | The Bottom Line | | The major U.S. indices moved lower this week, thanks to lackluster employment data released on Friday morning. However, many of these indices could be positioned for a bullish run-up, with MACD indicators looking to crossover in the near-term. Many traders will be especially watching for comments from the Federal Reserve about its bond-buying program, particularly given the lackluster employment data that could shake confidence. Next week, traders will be watching a number of economic indicators, including jobless claims on September 12th and producer price index and retail sales data due out on September 13th.
Charts courtesy of stockcharts.com
At the time of writing, Justin Kuepper did not own any shares in any of the companies mentioned in this article. | | | | | | | | | |  | | 


No comments:
Post a Comment